
 Wajdi Alkayal


Introduction
Maps provide one of the most eye-catching and aesthetically pleasing ways of presenting data tied to geographic locations. When looking to visually present data on a map, one powerful library you can use is D3.js.
However, despite being a feature-rich library with several graphing capabilities, D3 has a steep learning curve. If you are an absolute beginner, picking up D3 and immediately becoming productive is difficult. There are smaller and easier-to-learn alternatives to D3. One such alternative package is react-simple-maps, which relies on D3 packages under the hood.
React-simple-maps, like its name suggests, is a simple library for creating SVG maps in a React application. It boasts of being easy-to-learn, flexible, tiny, and extensible. The simplicity and the small bundle size make it an ideal library for creating simple maps.
This article will be a complete guide on how to create SVG maps using react-simple-maps.
What is react-simple-maps?
As mentioned in the introduction, react-simple-maps is a simple library for adding an SVG map to your React application. Because it uses the React Hooks API under the hood, you must be using React version 16.8 or later.
React-simple-maps internally relies on the D3 package d3-geo for creating maps. Other D3 packages used by react-simple-maps include d3-selection, d3-zoom, and topojson-client. For more about these D3 packages, you need to read the API section of the D3 documentation.
Most features offered by react-simple-maps are in form of simple React components that you import and render with the appropriate props. That is about how simple this package can be.
Let us learn more about react-simple-maps by building a simple SVG map.
How to create SVG maps using react-simple-maps
This section assumes you already have a React project set up. If you haven’t, you can use creat-react-app to set up a React project. It can get you writing React code almost instantly.
Before using react-simple-maps, you need to install it from npm using one of the commands below:
# Using npm
npm install react-simple-maps

# Using yarn
yarn add react-simple-maps
To create the most basic SVG map using react-simple-maps, you need to import and use the ComposableMap, Geography, and Geographies components.
The ComposableMap component is a wrapper for any map you want to create using react-simple-maps. It accepts props for setting your map’s width, height, projection, and projection configuration.
GeoJSON and TopoJSON
Before using react-simple-maps, you need to have a valid GeoJSON or TopoJSON file. In their simplest form, GeoJSON and TopoJSON files are JSON files that store the data you need to create a map. TopoJSON is a derivative of GeoJSON.
As hinted in the previous paragraph, you can draw some parallels between the two formats. However, each one of them has its strengths and weaknesses. One advantage of GeoJSON over TopoJSON is its simplicity and readability.
On the other hand, though more complex and less readable, TopoJSON files are orders of magnitude smaller than GeoJSON files. It has been established that a TopoJSON file is up to 80% smaller than its corresponding GeoJSON file. Therefore, due to the smaller bundle size, you are better off using TopoJSON if you want to transfer the file over the network or use it to create a map in the browser.
Since this article is not primarily about GeoJSON or TopoJSON, we won’t go into them in great detail here. There are online resources that do a great job explaining them in great detail if you want to learn more.
The Geographies component accepts the geography prop. Its value should be the URI for the GeoJSON or TopoJSON file. In this article, we shall use a simple TopoJSON file created for experimenting with the react-simple-maps package. There are other free TopoJSON files online with friendly licenses which you can also use. Similarly, you can also create a TopoJSON file with mapshaper using either the command line or the online tool.
Creating a simple map with react-simple-maps
The code below illustrates how to use react-simple-maps to create the most basic SVG map. It is a map showing the distribution of GDP per capita income of all countries in the world.
Ordinarily, you would retrieve such data sets from your database or a third party API. However, for this illustration, I am computing it from the TopoJSON because it comes with the Gross Domestic Product and the population estimates for each country. And that is the purpose of the generateGdpPerCapita function.
Because react-simple-maps relies on D3 packages for creating SVG map maps, I have also used a couple of packages from the D3 library:
import "./App.css";
import { ComposableMap, Geography, Geographies } from "react-simple-maps";
import { scaleSequential } from "d3-scale";
import { interpolatePiYG } from "d3-scale-chromatic";

function generateGdpPerCapita(geographies) {
  let minGdpPerCapita = Infinity;
  let maxGdpPercapita = -Infinity;
  geographies = geographies.map((geography) => {
    const { GDP_MD_EST, POP_EST } = geography.properties;
    const gdpPerCapita = Math.round((GDP_MD_EST * 1e6) / POP_EST);
    if (gdpPerCapita < minGdpPerCapita) {
      minGdpPerCapita = gdpPerCapita;
    }
    if (gdpPerCapita > maxGdpPercapita) {
      maxGdpPercapita = gdpPerCapita;
    }
    geography.properties.gdpPerCapita = gdpPerCapita;
    return geography;
  });
  return { minGdpPerCapita, maxGdpPercapita, modifiedGeographies: geographies };
}
const geoUrl =
  "https://raw.githubusercontent.com/zcreativelabs/react-simple-maps/master/topojson-maps/world-110m.json";

function App() {
  return (
    <ComposableMap projectionConfig={{ scale: 75 }}>
      <Geographies geography={geoUrl}>
        {({ geographies }) => {
          const { minGdpPerCapita, maxGdpPercapita, modifiedGeographies } =
            generateGdpPerCapita(geographies);

          const chromaticScale = scaleSequential()
            .domain([minGdpPerCapita, maxGdpPercapita])
            .interpolator(interpolatePiYG);

          return modifiedGeographies.map((geography) => {
            const { gdpPerCapita, rsmKey } = geography.properties;
            return (
              <Geography
                key={rsmKey}
                geography={geography}
                stroke="grey"
                strokeWidth={0.5}
                fill={chromaticScale(gdpPerCapita)}
              />
            );
          });
        }}
      </Geographies>
    </ComposableMap>
  );
}
export default App;
The output of the above code is the choropleth map below. In just a few lines of code, you can visually present data using a beautiful map in your React project.
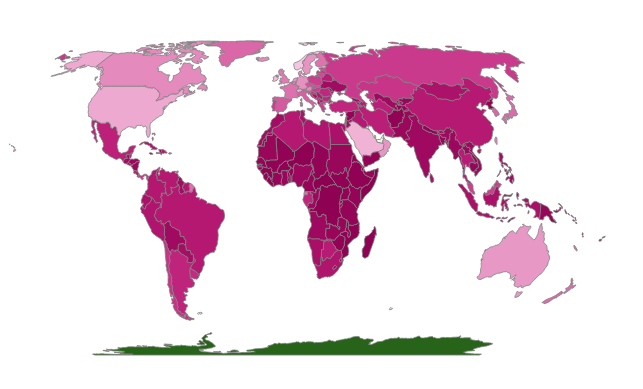
Before proceeding to the next section, it is worth noting that react-simple-maps uses the Equal Earth projection by default. It also supports several other projections, which you can read about in the documentation if you are interested. You can pass your preferred projection as the value of the projection prop of the ComposableMap component.
We have just created the most basic map. Let us add a spherical path around it.
How to add a spherical line around an SVG map
React-simple-maps has the Sphere component for adding a spherical path around the map. You need to import it just like the other components.
To add a spherical line around the SVG map, you need to render the Sphere component with the appropriate props, as illustrated in the code snippet below:
<ComposableMap projectionConfig={{ scale: 75 }}>
<Sphere stroke="grey" fill="#14121f" strokeWidth="1" />
<Geographies geography={geoUrl}>
{({ geographies }) => {
const { minGdpPerCapita, maxGdpPercapita, modifiedGeographies } =
generateGdpPerCapita(geographies);
const chromaticScale = scaleSequential()
.domain([minGdpPerCapita, maxGdpPercapita])
.interpolator(interpolatePiYG);
return modifiedGeographies.map((geography) => {
const { gdpPerCapita, rsmKey } = geography.properties;
return (
<Geography
key={rsmKey}
geography={geography}
stroke="grey"
strokeWidth={0.5}
fill={chromaticScale(gdpPerCapita)}
/>
);
});
}}
</Geographies>
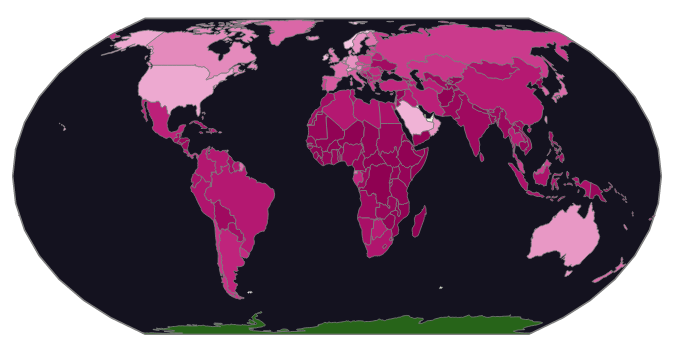
</ComposableMap>Your map should look like in the image below after adding the Sphere component. There is now a spherical outline around the map. I have also given the sphere a dark background. You can change it to any color of your choice by setting the value of the SVG fill attribute. The Sphere component takes any valid SVG attributes as props and applies them to the sphere.
How to add graticule to an SVG map
Sometimes you might want to add a network of intersecting latitudes and longitudes (graticule) as reference points on the map. React-simple-maps has the Graticule component for doing just that.
After importing the Graticule component, you can render it before the Geographies component for the lines to appear on top of the map. On the other hand, rendering it after the Geographies component will display the lines behind the map.
The code below modifies the previous map to include a Graticule. The only addition is the line where we are rendering the Graticule component:
<ComposableMap projectionConfig={{ scale: 75 }}>
<Sphere stroke="grey" fill="#14121f" strokeWidth="1" />
<Graticule stroke="#F53" strokeWidth={0.5} />
<Geographies geography={geoUrl}>
{({ geographies }) => {
const { minGdpPerCapita, maxGdpPercapita, modifiedGeographies } =
generateGdpPerCapita(geographies);
const chromaticScale = scaleSequential()
.domain([minGdpPerCapita, maxGdpPercapita])
.interpolator(interpolatePiYG);
return modifiedGeographies.map((geography) => {
const { gdpPerCapita, rsmKey } = geography.properties;
return (
<Geography
key={rsmKey}
geography={geography}
stroke="grey"
strokeWidth={0.5}
fill={chromaticScale(gdpPerCapita)}
/>
);
});
}}
</Geographies>
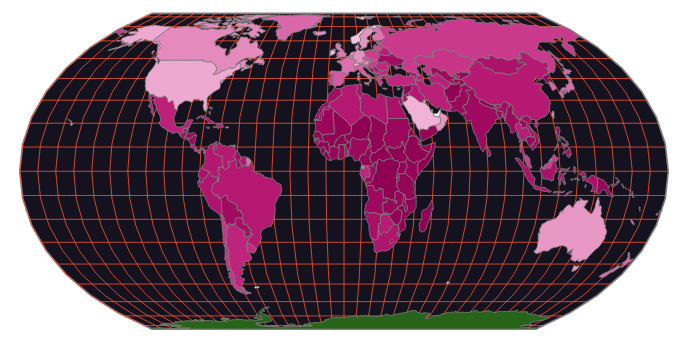
</ComposableMap>The image below shows what the map will look like after adding graticule to it. You will notice there is a network of intersecting latitudes and longitudes on the map.
How to create lines and markers on an SVG map
React-simple-maps has a built in feature for creating lines and markers on the SVG map. You can create a line by connecting two or more coordinates using the Line component. It accepts the to and from props if your goal is to connect two coordinates. If you intend to draw a line through a series of points, you need to use the coordinates prop. The coordinates prop takes an array whose entries should be arrays of the form [longitude, latitude].
You can also specify the stroke color and stroke width when drawing a line using stroke and strokeWidth props, respectively.
It is worth noting that when a feature on the map is west of the prime meridian, its longitude is negative. And positive when it is to the east. Similarly, a point will have a positive latitude when north of the equator and a negative when to the south.
React-simple-maps also has the Marker component for adding a marker to the map. The marker can be any valid SVG. You can specify its position using the coordinates prop, whose value is an array with the form [longitude, latitude].
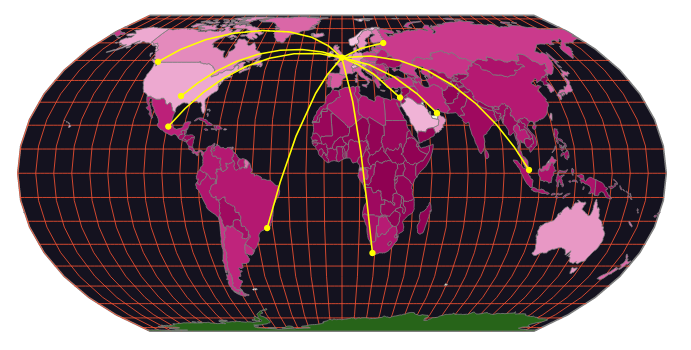
The code below illustrates how you can add lines and markers to the SVG map. For this illustration, we shall represent some popular British Airways destinations on our map using lines and markers. Typically, you would retrieve such data from your database.
I have hard-corded it here for this illustration:
const flightDestinations = [
  {
    from: { coord: [-0.128, 51.507], city: "London" },
    to: { coord: [55.271, 25.205], city: "Dubai" },
  },
  {
    from: { coord: [-0.128, 51.507], city: "London" },
    to: { coord: [-96.797, 32.777], city: "Dallas" },
  },
  {
    from: { coord: [-0.128, 51.507], city: "London" },
    to: { coord: [-123.121, 49.283], city: "Vancouver" },
  },
  {
    from: { coord: [-0.128, 51.507], city: "London" },
    to: { coord: [-43.173, -22.907], city: "Rio De Janiero" },
  },
  {
    from: { coord: [-0.128, 51.507], city: "London" },
    to: { coord: [18.424, -33.925], city: "Cape Town" },
  },
  {
    from: { coord: [-0.128, 51.507], city: "London" },
    to: { coord: [34.782, 32.085], city: "Tel Aviv" },
  },
  {
    from: { coord: [-0.128, 51.507], city: "London" },
    to: { coord: [30.361, 59.931], city: "St petersburg" },
  },
  {
    from: { coord: [-0.128, 51.507], city: "London" },
    to: { coord: [103.82, 1.352], city: "Singapore" },
  },
  {
    from: { coord: [-0.128, 51.507], city: "London" },
    to: { coord: [-99.133, 19.433], city: "Mexico City" },
  },
];
In the code below, the from props of the Line component contains the coordinates of London, and the to props contain the destination coordinates. I have placed circular markers at the origin and destination points using the Marker component:
    <ComposableMap projectionConfig={{ scale: 75 }}>
      <Sphere stroke="grey" fill="#14121f" strokeWidth="1" />
      <Graticule stroke="#F53" strokeWidth={0.5} />
      <Geographies geography={geoUrl}>
        {({ geographies }) => {
          const { minGdpPerCapita, maxGdpPercapita, modifiedGeographies } =
            generateGdpPerCapita(geographies);

          const chromaticScale = scaleSequential()
            .domain([minGdpPerCapita, maxGdpPercapita])
            .interpolator(interpolatePiYG);

          return modifiedGeographies.map((geography) => {
            const { gdpPerCapita, rsmKey } = geography.properties;
            return (
              <Geography
                key={rsmKey}
                geography={geography}
                stroke="grey"
                strokeWidth={0.5}
                fill={chromaticScale(gdpPerCapita)}
              />
            );
          });
        }}
      </Geographies>

      {flightDestinations.map((route) => (
        <>
          <Line
            key={route.to.city}
            from={route.from.coord}
            to={route.to.coord}
            stroke="yellow"
            strokeWidth={1}
            strokeLinecap="round"
          />
          <Marker coordinates={route.to.coord}>
            <circle r={2} fill="yellow" />
          </Marker>
        </>
      ))}
      <Marker coordinates={[-0.128, 51.507]}>
        <circle r={2} fill="yellow" />
      </Marker>
    </ComposableMap>
After adding lines and markers, the map now looks like in the image below. Notice the yellow curved lines and the yellow circular markers at the start and end of the lines.
How to create annotations on an SVG map
In the previous subsection, we looked at how to create lines and markers on the SVG map. You can also add annotations to the map in a similar way.
To add annotations, you need to pass the coordinates of the subject of the annotation and the annotation offset to the Annotations component.
Below is a modification of the previous code illustrating how you can add annotations to the SVG map. The difference between them is the Annotations component:
<ComposableMap projectionConfig={{ scale: 75 }}>
<Sphere stroke="grey" fill="#14121f" strokeWidth="1" />
<Graticule stroke="#F53" strokeWidth={0.5} />
<Geographies geography={geoUrl}>
{({ geographies }) => {
const { minGdpPerCapita, maxGdpPercapita, modifiedGeographies } =
generateGdpPerCapita(geographies);
const chromaticScale = scaleSequential()
.domain([minGdpPerCapita, maxGdpPercapita])
.interpolator(interpolatePiYG);
return modifiedGeographies.map((geography) => {
const { gdpPerCapita, rsmKey } = geography.properties;
return (
<Geography
key={rsmKey}
geography={geography}
stroke="grey"
strokeWidth={0.5}
fill={chromaticScale(gdpPerCapita)}
/>
);
});
}}
</Geographies>
{flightDestinations.map((route) => (
<>
<Line
key={route.to.city}
from={route.from.coord}
to={route.to.coord}
stroke="yellow"
strokeWidth={1}
strokeLinecap="round"
/>
<Marker coordinates={route.to.coord}>
<circle r={2} fill="yellow" />
</Marker>
<Annotation subject={route.to.coord} dx={0} dy={0} fill="yellow">
<text fontSize="10px" x="3">
{route.to.city}
</text>
</Annotation>
</>
))}
<Marker coordinates={[-0.128, 51.507]}>
<circle r={2} fill="yellow" />
</Marker>
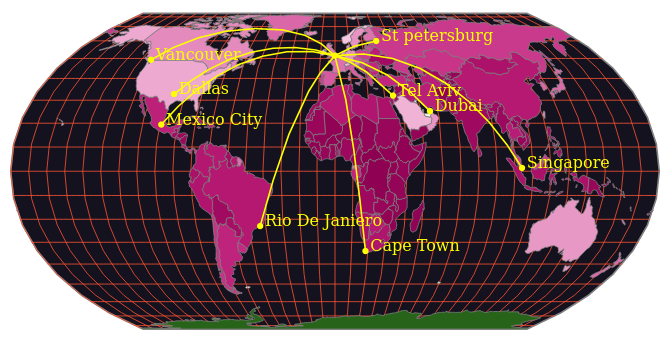
</ComposableMap>The map now looks like in the image below after adding annotations.
React-simple-maps bundle size and dependencies
As mentioned in the introduction, react-simple-maps relies on D3 packages under the hood for creating SVG maps. Some of these packages include d3-geo, d3-selection, d3-zoom, and topojson-client. Despite the number of D3 packages it relies on, the minified and gzipped bundle size of react-simple-maps is 34.8 kB, according to bundlephobia. Given its simplicity and utility, that is quite a small bundle size.
D3, the third party packages react-simple-maps relies on, is a very mature and popular SVG, Canvas, and HTML-based data visualization library. It also has an active community of maintainers. You shouldn’t, therefore, lose sleep over the quality of the D3 packages.
Judging by the number of issues and the commit history on the project repository, it appears react-simple-maps is not actively maintained. Therefore, if you decide to use it in production, be prepared to make updates and bug fixes yourself.
Conclusion
React-simple-maps is a simple mapping package you can use in a React application. Its simplicity and tiny bundle size make it an excellent choice for adding basic maps to your React app. However, it may fall short of meeting your expectations if you want to build a more complex map. In that case, you will have to opt for a more powerful and feature-rich library like D3.
It has components such as Sphere, Graticule, Geography, Geographies, and Markers. You have to import and render these built in components with the appropriate props to create a map or add features. It makes creating a map with react-simple-maps a breeze.
Due to its simplicity, this article has hinted at nearly all the features react-simple-maps has to offer. However, you can read the documentation or the source code on GitHub to get familiar with a few other features not mentioned here or get a complete feel of the package.
On the downside, there hasn’t been much activity on the project’s GitHub repository for at least one year. That is a clear indication that the package is not actively maintained. Therefore, as you use it in production, you will be responsible for making updates and fixing bugs whenever the need arises.
Full visibility into production React apps
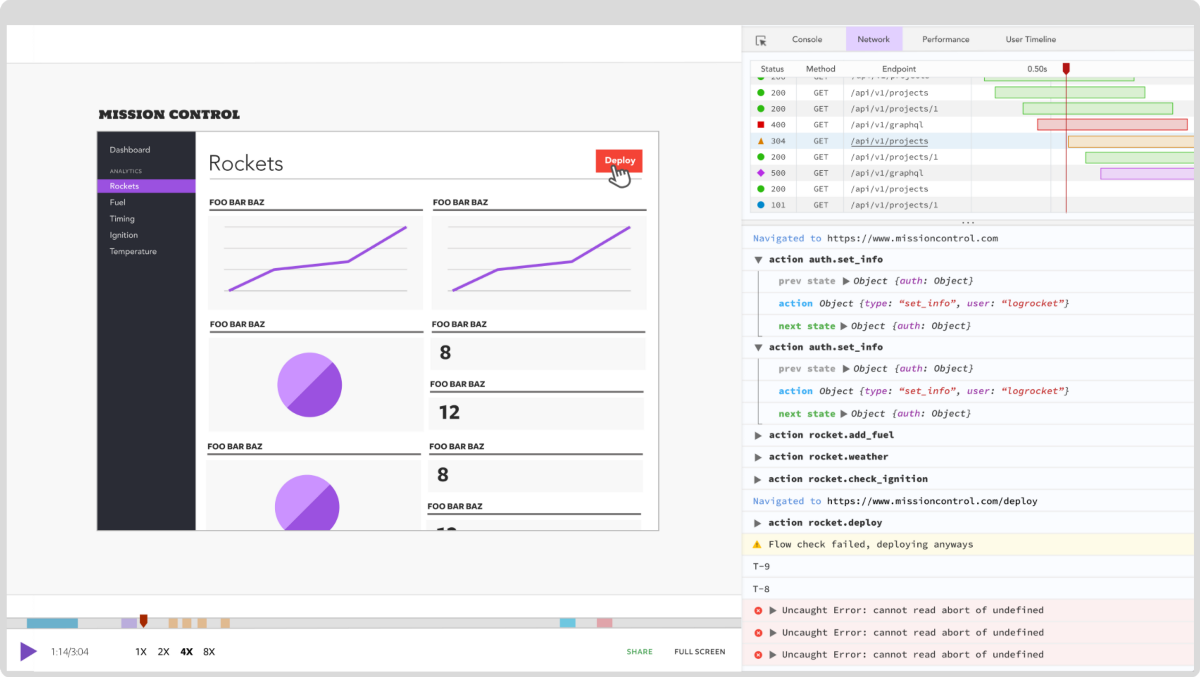
Debugging React applications can be difficult, especially when users experience issues that are hard to reproduce. If you’re interested in monitoring and tracking Redux state, automatically surfacing JavaScript errors, and tracking slow network requests and component load time, try LogRocket.


WMK Tech Copyright © 2024. All rights reserved

